When I was taking a Big Data course under Professor Rami El-Youssef at the University of Texas at Dallas. I learned a lot about HDFS, Hive, Impala, and Spark, which are essential tools for big data processing. With prof’s assignments I was able to get hands on experience in each topic. However, I wanted to put all these learnings together with a project.
So the professor provided me with a truck telematics dataset which was essentially 3 csv files and asked me to come up with some business problems and solve them. The data was related to three entities: trucks, drivers, and traffic violations. After a lot of brainstorming, I was able to formulate three business requirements:
-
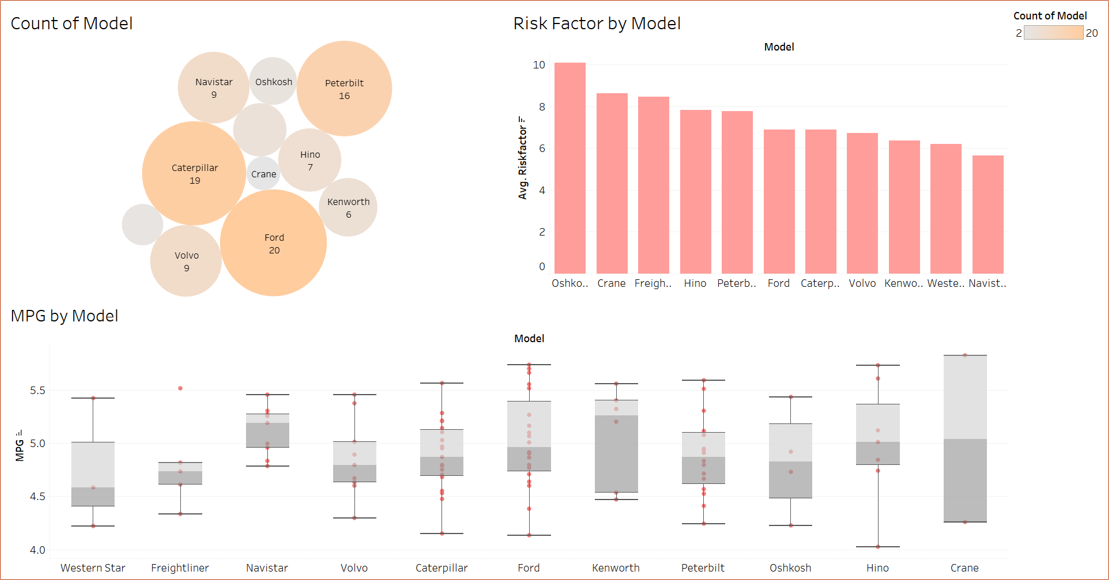
Fleet Performance Dashboard: A dynamic dashboard that provides a holistic view of fleet performance by tracking key metrics such as the number of trucks in the fleet, truck make, and fuel economy (MPG). This dashboard would enable fleet managers to quickly identify areas of concern and take proactive measures to optimize performance.
-
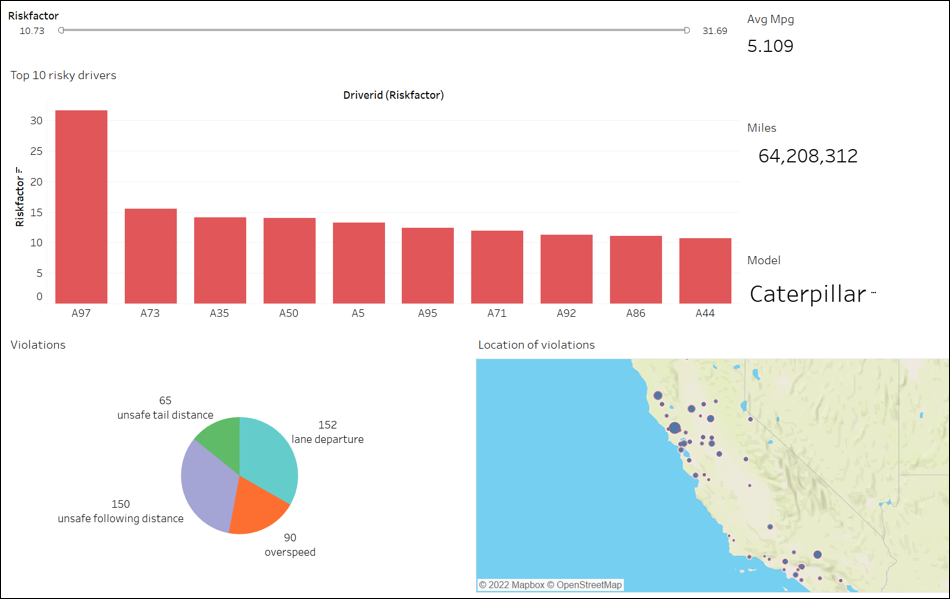
Driver Risk Analysis: An interactive dashboard that uses violation data to identify risky drivers and their violation hotspots. The dashboard would enable fleet managers to take corrective measures such as training or coaching to reduce the frequency of violations and improve driver safety.
-
Fuel Efficiency Analysis: A statistical analysis to identify the truck models that had the best fuel economy (MPG) ratings among the fleet. This analysis would enable fleet managers to identify the most fuel-efficient truck models and make informed decisions when expanding or upgrading their fleet.
For this, I had to perform some transformations and build new tables to store the transformed data. As I worked on this task, I realized the importance of having a clear mental model of the table structure. To ensure that I could keep track of the data flow and transformations, I came up with a visual representation of the table structure. While this was not an ERD diagram, it helped me organize my thoughts and build the necessary tables.
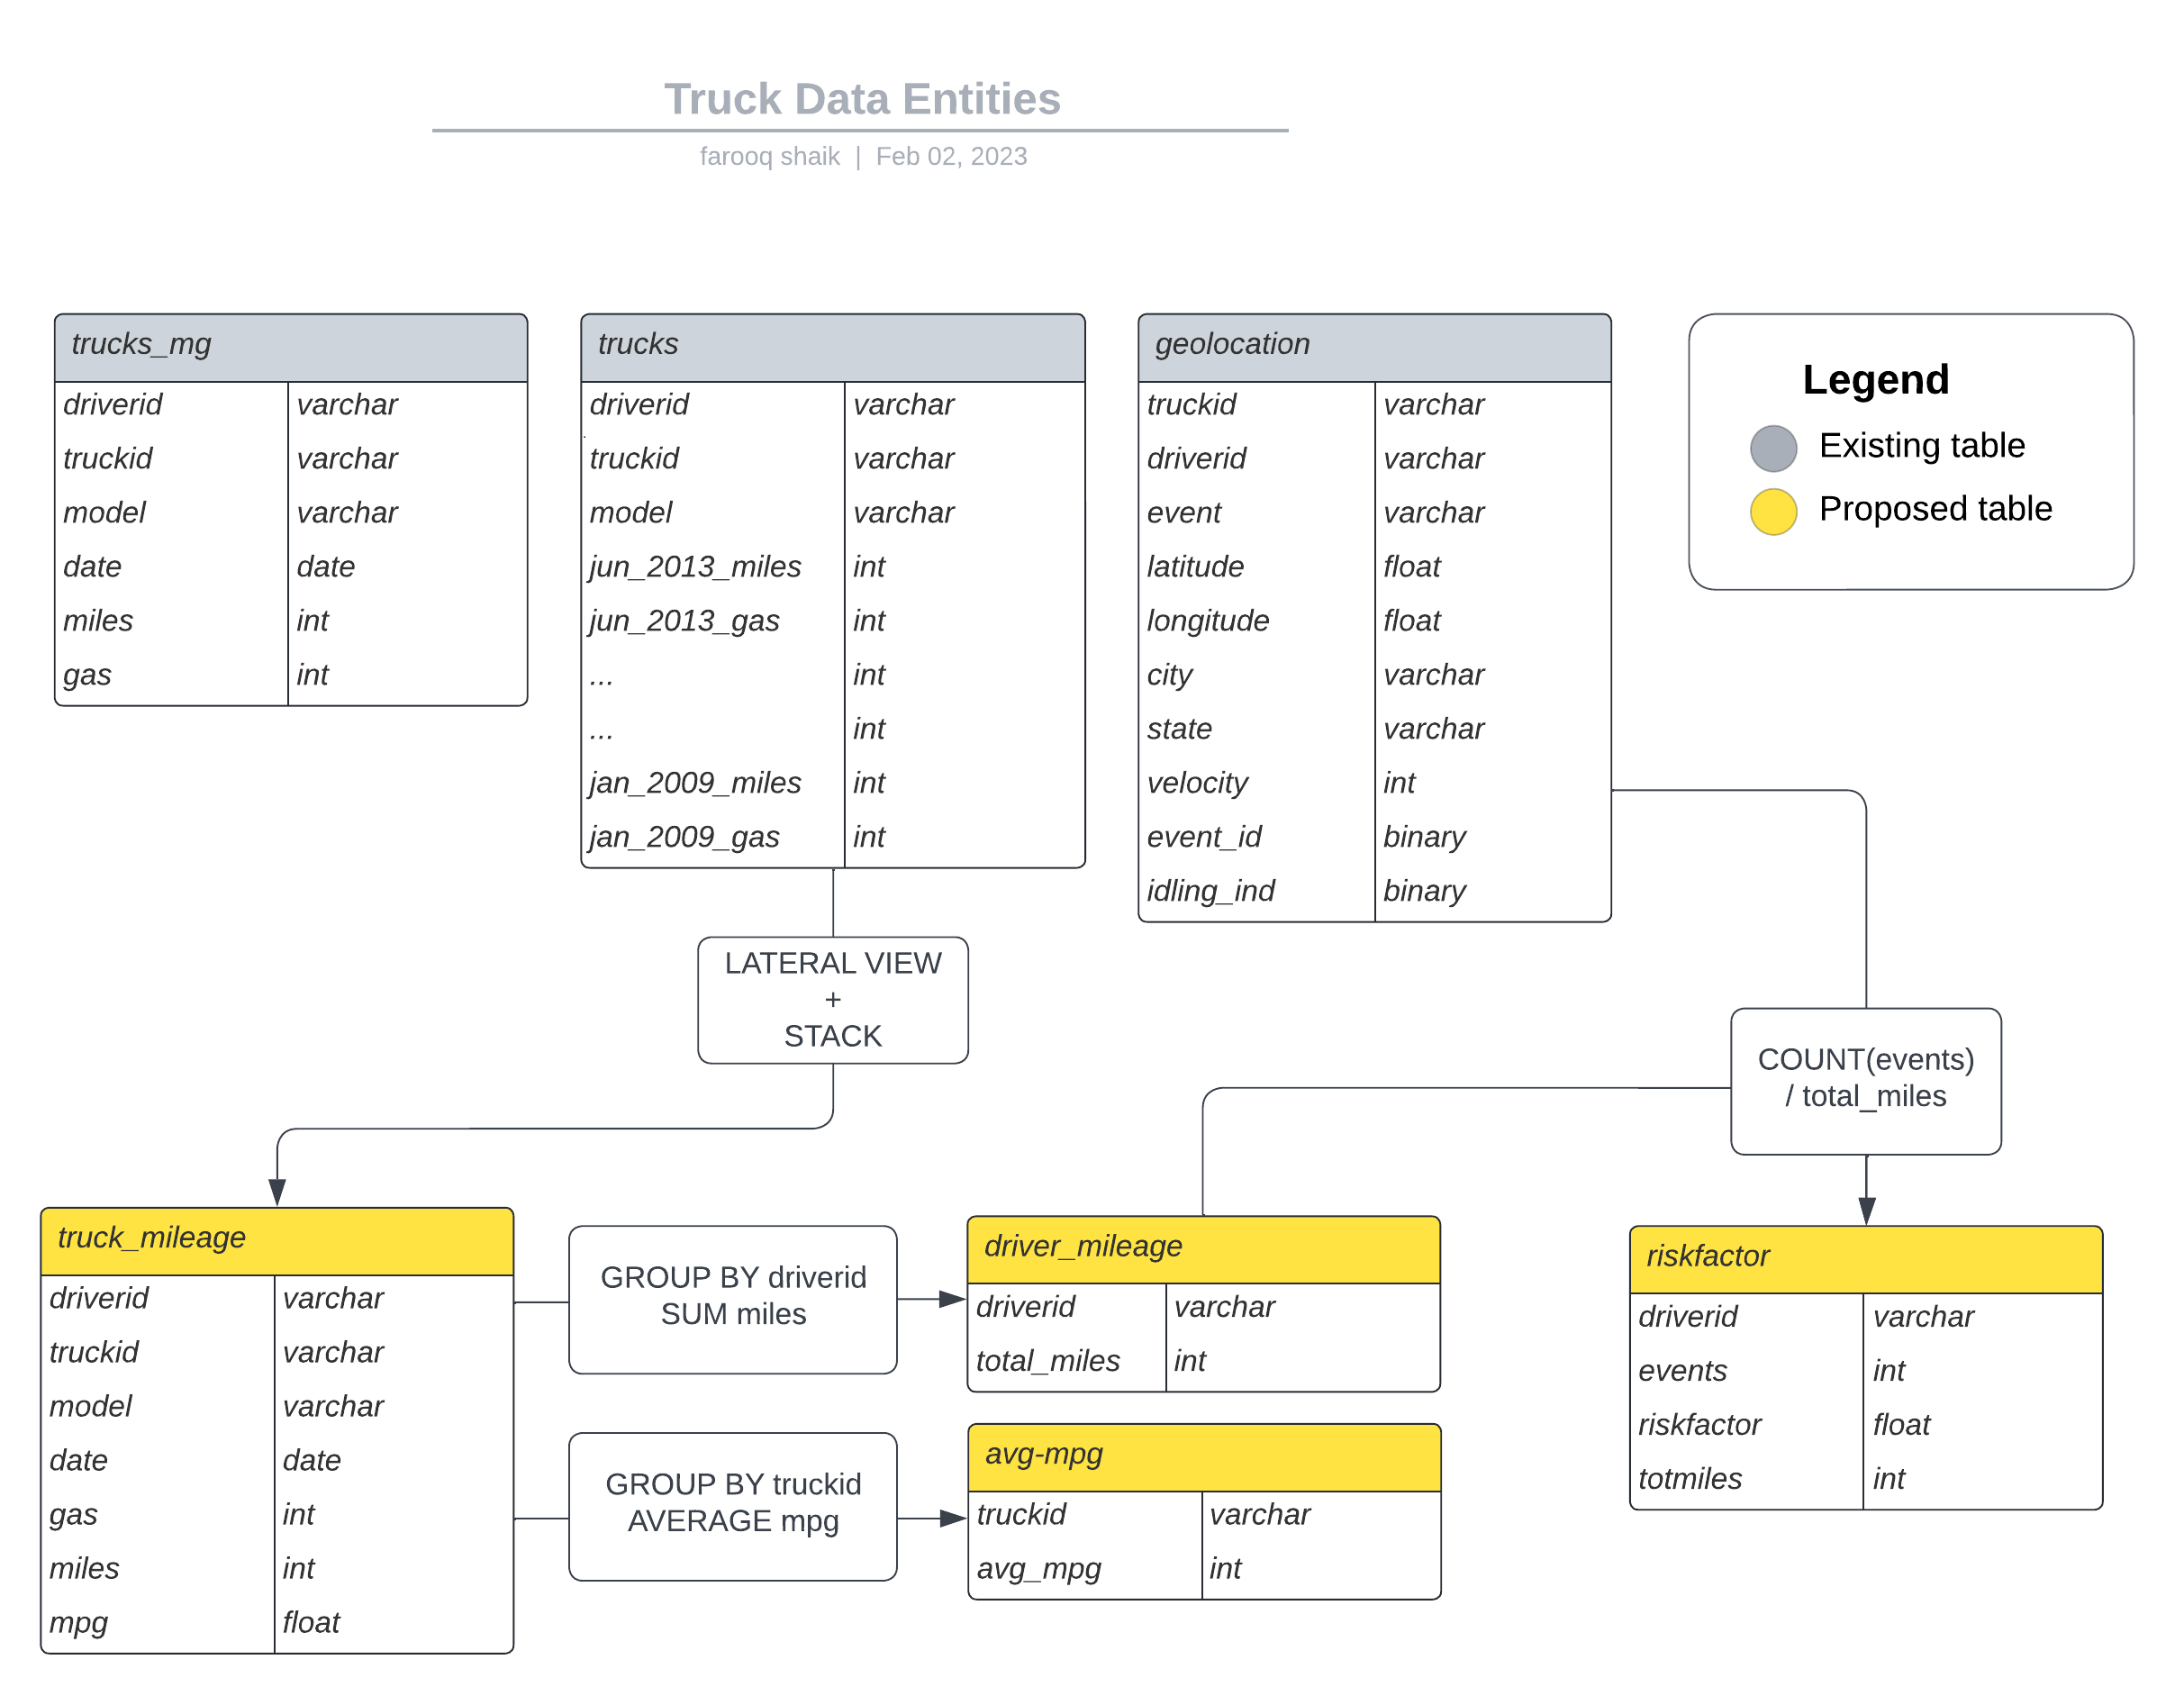
Once I had these transformations on paper I went ahead and created them using SQL DDL statements with HiveQL and Impala. This is a sample DDL statement
-- create table
CREATE TABLE geolocation
(
truckid string,
driverid string,
event string,
latitude DOUBLE,
longitude DOUBLE,
city string,
state string,
velocity BIGINT,
event_ind BINARY,
idling_ind BINARY
)
ROW FORMAT DELIMITED
FIELDS TERMINATED BY ','
STORED AS TEXTFILE
TBLPROPERTIES (”skip.header.|ine.count"="l");
Later I had to load the data from the csv files, and do some sanity checks to make sure that all the data was inplace like needed.
-- load data
LOAD DATA INPATH '/user/hive/warehouse/project/geolocation.csv'
INTO TABLE geolocatlon;
INVALIDATE METADATA
-- sanity check
SELECT COUNT(*) FROM geolocation;
The next step was to use BI and Data analytics to solve the business problems and gain meaningful insights from the data.
The first step was to create a dynamic dashboard in Tableau that would provide a comprehensive view of fleet performance metrics. To do this, I needed to connect to Tableau via an ODBC driver for Impala which I downloaded from the internet. Then I opened Tableau and used Cloudera Hadoop connector to connect to my Hadoop server.I got the server ip using ifconfig command, I was able to create the charts and build the dashboard, providing valuable insights into fleet performance.
These were the 2 dashboards:
Next, I connected the Hive server with RStudio with help from this post I imported the trucks_mg table and filtered for the top 3 most owned trucks by make, which were - Ford, Caterpillar, Peterbilt. These were the mean mpg’s for each truck make.
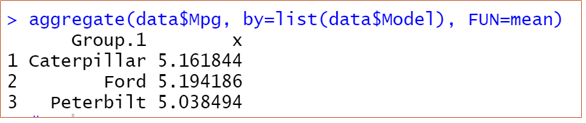
Now the idea is to check if the difference between the mean mpg’s of these 3 truck makes is statistically significant or if it is by chance. To do this I applied ANOVA on columns model and mpg. For this test to be valid the mpg values should solely depend on truck engine performance and not any other factors like driver behaviour, fuel quality. Since there is not enough information to check for randomization, I assumed it is for time being.
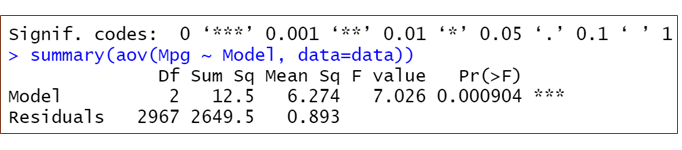
Based on the p-value, I rejected the null hypothesis that all the MPG means are equal, thus we conclude that at least two models have significantly different MPG ratings.
I then applied Tukey HSD test to identify any significant differences between every 2 groups.
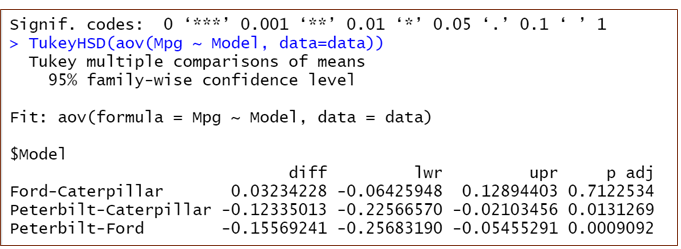
when I looked at p-values to compare each pair, these were the conclusions :
- Ford v/s Caterpillar:- There is no significant difference between their MPG
- Peterbilt v/s Caterpillar:- There is no significant difference at 99% Significance level. However, at 95% Confidence Interval there is significant difference between these models.
- Peterbilt v/s Ford:- There is significant difference between Peterbilt and Ford at 99.9% level.
Thus, by leveraging these powerful data analytics tools and techniques, I was able to convert 3 csv files to valuable insights that would enable fleet managers to make data-driven decisions and optimize fleet performance. Data really is the new oil!
You can find more details on this repository –> Data Analysis in Hadoop