Google Cloud Platform allows you too visualize data on resource usage through the monitoring page. But this data is not accessible in raw format. During my internship, I needed this data on one of my dashboards. I thought there would be an easy way to export it, but boy was I wrong.
A senior pointed me to this resource -> Reading metric data so I figured that the only way to collect metric data is by requesting the Monitoring API.
So I came up with a python script that does it (simplified) :
from datetime import datetime, date, timedelta
from google.cloud import bigquery, monitoring_v3


class Collector:
    def __init__(self, project_id: str, location: str = "us-central1"):
        self.client = monitoring_v3.MetricServiceClient()
        self.project_id = project_id
        self.location = location
        self.project_path = f"projects/{project_id}"

    def fetch_metric(self, metric_type: str, metric_name: str):
        """Returns metric data for input metric and resource types.
        Calculates metrics using MQL from 00:00 to 23:59:59 for yesterday
        Code template : https://cloud.google.com/monitoring/custom-metrics/reading-metrics"""
        end_time = datetime.combine(date.today() - timedelta(days=1), datetime.max.time())
        start_time = datetime.combine(date.today() - timedelta(days=1), datetime.min.time())
        end_time_sec = int(end_time.timestamp())
        start_time_sec = int(start_time.timestamp())
        nanos = int((end_time.timestamp() - end_time_sec) * 10 ** 9)
        interval = monitoring_v3.TimeInterval(
            {
                "end_time": {"seconds": end_time_sec, "nanos": nanos},
                "start_time": {"seconds": start_time_sec},
            }
        )

        # I am aggregating one day's worth of data to one point
        aggregation = monitoring_v3.Aggregation(
            {
                "alignment_period": {"seconds": 86400},
                "per_series_aligner": monitoring_v3.Aggregation.Aligner.ALIGN_MAX,   # choose align method
            }
        )

        results = self.client.list_time_series(
            request={
                "name": self.project_path,
                "filter": f'metric.type = "{metric_type}"',
                "interval": interval,
                "view": monitoring_v3.ListTimeSeriesRequest.TimeSeriesView.FULL,
                "aggregation": aggregation
            }
        )

        for result in results:
            data = [
                {"Time": end_time.strftime('%Y-%m-%d %H:%M:%S'),
                 "MetricType": metric_name,
                 "MetricValue": result.points[0].value.int64_value}
            ]

        return data

    def load_metric(self, data, dataset, table):
        """Writes data to Big Query table"""
        client = bigquery.Client(project=self.project_id)
        table_ref = "{}.{}".format(dataset, table)
        table = client.get_table(table_ref)
        errors = client.insert_rows(table, data)
        if not errors:
            print("New rows have been added.")
        else:
            print("Encountered errors while inserting rows: {}".format(errors))


if __name__ == '__main__':

    collector = Collector(project_id='silicon-synapse-372206')

    response = collector.fetch_metric(
        metric_type="storage.googleapis.com/storage/total_bytes",
        metric_name="bucket_size")

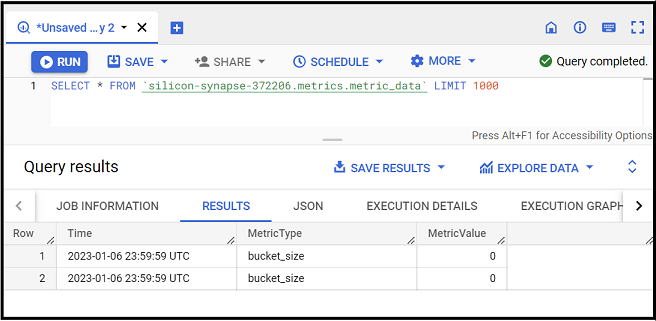
    collector.load_metric(data=response, dataset='metrics', table='metric_data')
If you notice its just 2 functions fetch_metric() to request the metric data from monitoring API, and load_metric() to load the response to a Big Query table.
Now to put this script on a daily schedule I need 2 things, a scheduler and some compute that scales to zero when not in use.
Cloud Run Job was the perfect service for this use case.
To use cloud run I need a container, so I created a python image and had the following commands in my docker file
FROM python:3.10-slim

ENV PYTHONBUFFERED True
ENV APP_HOME /app

WORKDIR ${APP_HOME}

COPY ./src/ ./

RUN pip install -r requirements.txt

CMD ["python", "main.py"]
My folder structure looks like so
.
└── metric_collector/
    ├── src/
    │   ├── main.py
    │   └── requirements.txt
    ├── .dockerignore
    └── Dockerfile
to build and push the container to GCP container registry I used the foloowing commands in terminal. You might face some authentication issues and you can use the command gcloud auth application-default login to get past that
docker build -t gcr.io/<project_id>/collector:latest .
docker push gcr.io/<project_id>/collector:latest
and with that I had the container created in GCR

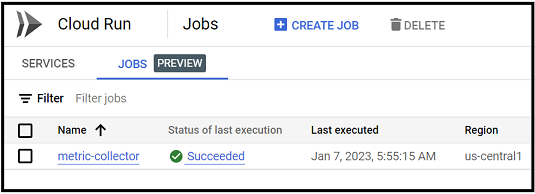
Next step is to create the cloud run job which was very straight forward, once created I had to setup a schedule under “TRIGGERS” tab, it enables a cloud scheduler instance to send HTTP requests to cloud run job, you would need a service account which has these permissions : Cloud Run Invoker ; Monitoring Viewer ; and a permission to enable write access to Big Query table
You can find documentation on creating cloud run jobs on schdule here: https://cloud.google.com/run/docs/create-jobs https://cloud.google.com/run/docs/execute/jobs-on-schedule
Once you all that setup, the cloud run job should run as per your scheduler and write data to Big Query


Here is how the final architecture looked like :

You can find all the code here –> GCP-Monitoring-Metrics